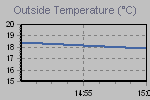
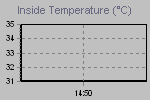
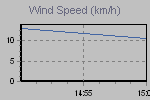
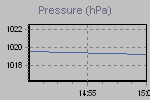
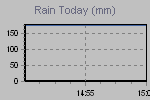
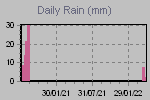
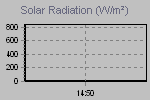
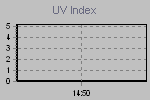
These graphs present the Wind, Temperature, Pressure , Rainfall, Solar/Sun and UV trends for the last 48 hours.The thumbnail graphs are sampled every 5 minutes. Click on a thumbnail to display the corresponding larger graph in the panel above it. The large graphs are sampled every minute. |
 |
||||
 |
 |
 |
 |
 |
 |
 |
 |
 |
 |
 |
 |
 |
||