komoka village weather
Latitude N 42° 57' 36" Longitude W 81° 26' 18" Elevation 827 ft
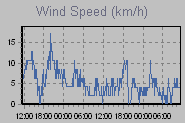
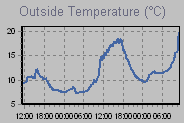
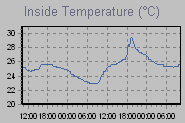
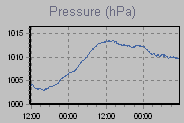
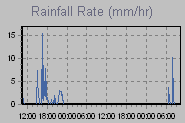
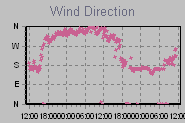
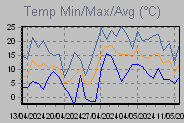
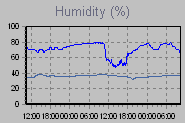
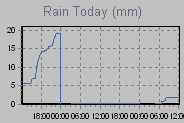
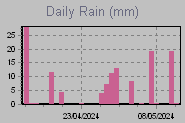
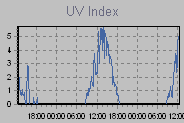
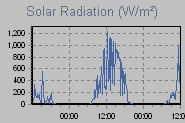
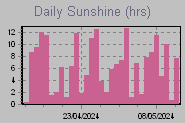
These graphs present the temperature, pressure, rainfall, and wind speed trends for the last 48 hours.
The thumbnail graphs are sampled every ten minutes. Click on a thumbnail to display the corresponding larger graph in the panel above it. The large graphs are sampled every minute.

| Click on a thumbnail to show a large graph in the panel above. | ||||
 |
 |
 |
 |
 |
 |
 |
 |
 |
 |
 |
 |
 |
||
| :now: :gauges: :gauges-ss: :today/yesterday: :month: :year: :records: :monthly: :trends: :observations: :vp2-console: :vue-console: :data-grabber: :console: :sys-status: :data-summary: :forum::webcam: | ||||
Page updated 15/06/2026 4:15:00 PM
powered by
Cumulus v1.9.4 (10992)